
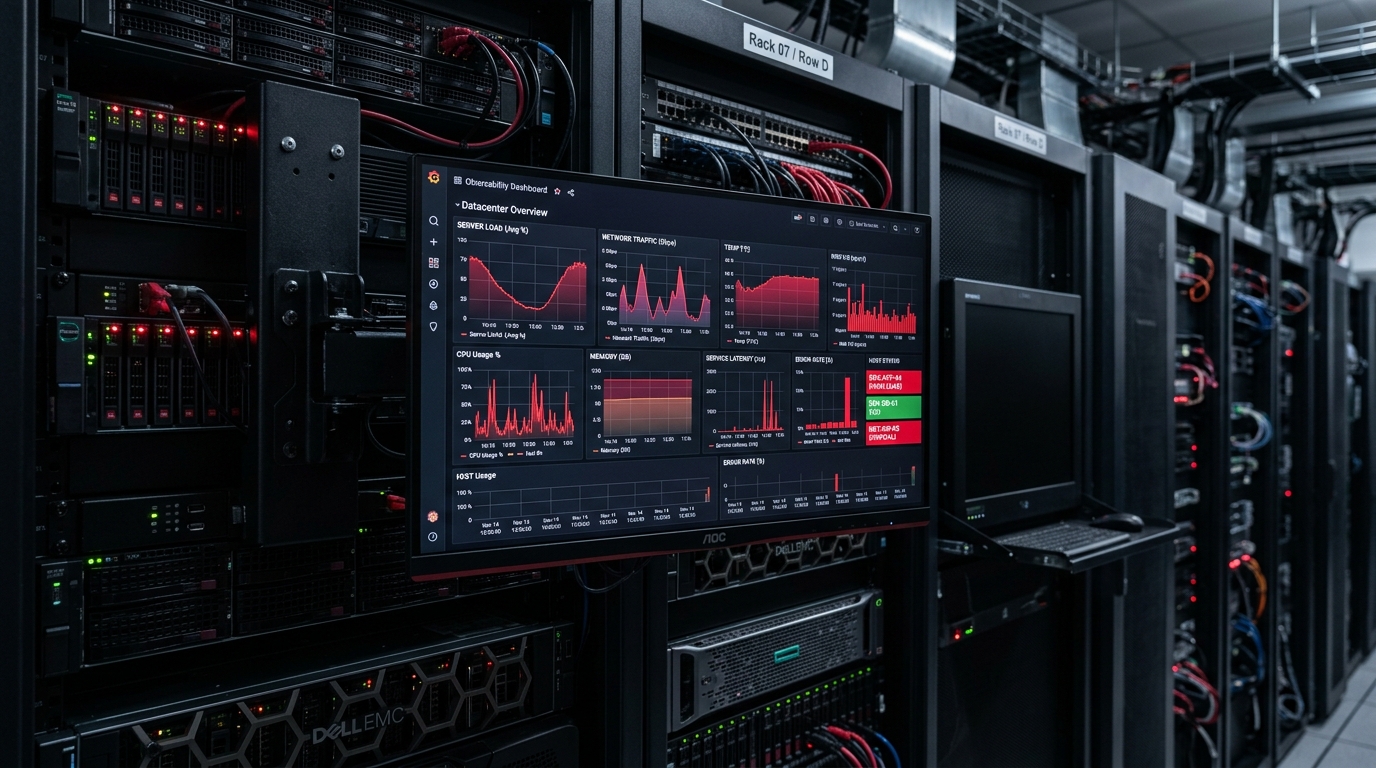
Every VP of Infrastructure and FinOps lead shares a common traumatic memory: opening a monthly Datadog invoice to discover that a routine microservice rollout transformed a predictable $8,000 monthly monitoring bill into a $74,000 financial catastrophe. When the invoice line items are audited, host agent fees and log ingestion are rarely the primary culprits. The smoking gun is almost universally Custom Metrics.
Unlike standard infrastructure metrics gathered by the core Datadog agent, custom metrics are priced according to an unforgiving combinatorial formula. Understanding how this pricing model operates—and deploying architectural firewalls to arrest cardinality before packets leave your private VPC—is the only way to tame enterprise observability expenditure in 2026.
Why Do Datadog Custom Metrics Cause Massive Observability Invoice Spikes?
In Datadog’s telemetry engine, a “custom metric” is not defined merely by the metric name (e.g., api.checkout.latency). A billable timeseries is defined by the unique combination of the metric name and every distinct tag key-value pair attached to it.
Consider a junior engineer instrumenting a checkout endpoint. They emit a single histogram metric with four tags:
statsd.increment('api.checkout.success', tags=[
    'region:us-east-1',        # 3 values (us-east-1, us-west-2, eu-west-1)
    'tier:premium',            # 2 values (premium, standard)
    'payment_method:stripe',   # 4 values (stripe, paypal, apple_pay, klarna)
    'customer_id:usr_998124'   # 50,000 unique active users per day!
])
The mathematical result is not 1 metric. The total distinct billable timeseries created is: 3 × 2 × 4 × 50,000 = 1,200,000 timeseries. At Datadog’s standard rate of $5.00 per 100 custom metrics per month, this single line of code generates an unbudgeted monthly cost of:
Because the Datadog Agent forwards DogStatsD packets via UDP asynchronously, the application runs seamlessly with zero errors. The explosion is only discovered weeks later when the accounting department receives the monthly invoice.
How Do You Audit and Eliminate High-Cardinality Metric Tags in Production?
Executing a forensic cleanup of custom metrics requires a three-tier mitigation protocol:
- Metric Summary Forensics: Within the Datadog console, navigate to Metrics → Summary and sort by Estimated Monthly Cost and Distinct Tag Values. Identify the “Top 5” metrics generating >80% of timeseries. In 95% of enterprise audits, fewer than 10 rogue metrics are responsible for nearly the entire overage.
- Metrics Without Limits (MWL) Tag Whitelisting: Datadog’s MWL feature allows administrators to decouple ingested tags from indexed tags. For a offending metric, you can configure MWL to retain only
regionandtier, while instructing Datadog’s ingestion pipeline to discardcustomer_idorsession_id. This immediately reduces billable timeseries by 99% without modifying application source code. - OpenTelemetry Collector Filtering at the Edge: Relying on Datadog’s server-side MWL still incurs network egress costs and risks unmonitored metric spikes. The superior engineering approach is placing an OpenTelemetry Collector gateway between your Kubernetes clusters and Datadog. Using the
transformprocessor, drop all tags matching regex UUID patterns (^[0-9a-f]{8}-.*) or user identifiers before packets traverse cloud NAT gateways, as detailed in our analysis of The AWS NAT Gateway Egress Toll & VPC Endpoint Forensics.
| Observability Architecture | Custom Metric Pricing (Per 100 Timeseries) | High-Cardinality Tag Penalty | Estimated Annual TCO (1M Timeseries) | Operational Maintenance Overhead | Storage Footprint & Compression |
|---|---|---|---|---|---|
| Datadog SaaS (Raw Ingestion) | $5.00 / month | Extreme ($50 / 1k series) | $60,000 / year | Zero (SaaS turnkey) | Proprietary cloud storage |
| Datadog + Metrics Without Limits (Aggregated) | $5.00 / month (on capped series) | Moderate (Discards unapproved tags) | $12,000 – $18,000 / year | Low (Console configuration) | Proprietary cloud storage |
| Hybrid: OTel Router + VictoriaMetrics (On-Prem / Colocated) | $0 (Hardware amortized) | Zero (Handles 100M+ series natively) | $4,800 / year (Bare-metal server) | Medium (Single-binary maintenance) | ZSTD block compression (~0.5 bytes/point) |
| eBPF Kernel Observability (Cilium + Tetragon) | $0 (Kernel ring-buffer) | Zero (In-kernel aggregation) | $2,400 / year (Infrastructure compute) | Medium (eBPF Linux kernel configuration) | Prometheus TSDB or Parquet on NVMe |
Can Self-Hosted VictoriaMetrics or OpenTelemetry Replace Datadog for High-Throughput Metrics?
For organizations generating tens of millions of timeseries across high-frequency financial engines, ad-tech auction systems, or IoT fleets, paying SaaS per-metric pricing is fundamentally unsustainable. The industry-standard architecture in 2026 is a Split-Brain Telemetry Pipeline:
- Core Infrastructure & Host APM in Datadog: Maintain Datadog agents on production Kubernetes worker nodes for infrastructure dashboards, out-of-the-box AWS integrations, and PagerDuty alert escalation. Host metrics and synthetics remain high-value and predictable.
- Custom Application Telemetry in VictoriaMetrics: Route all high-cardinality application metrics (e.g., payment latencies, sub-account breakdowns, API route timings) to a self-hosted VictoriaMetrics cluster running on dedicated bare-metal NVMe. VictoriaMetrics ingests up to 1 million data points per second per CPU core, effortlessly storing 50 million active timeseries while consuming a fraction of the RAM required by vanilla Prometheus.
By implementing an OpenTelemetry routing rule that directs host metrics to Datadog and application-level custom metrics to VictoriaMetrics, enterprise engineering teams routinely reduce their annual Datadog spend from $250,000 down to $35,000, as demonstrated in our benchmark on eBPF Kernel Observability vs. Datadog APM.
Frequently Asked Questions About Datadog Custom Metric Optimization
How does Datadog count custom metrics?
Datadog calculates custom metrics based on distinct metric timeseries, not raw data point volume. A timeseries is defined as a unique combination of a metric name and its associated tag key-value pairs. Sending 1 data point per second or 1 data point per hour costs the exact same; what increases the bill is adding new unique tag combinations.
What happens if I exceed my Datadog custom metric quota?
Datadog does not drop your metrics or throttle ingestion. Instead, it ingests all data seamlessly and bills overages at the on-demand rate (typically $5.00 per month per 100 metrics above your plan allocation), resulting in massive surprise invoices at the end of the billing cycle.
Is VictoriaMetrics fully compatible with Prometheus PromQL?
Yes. VictoriaMetrics supports the Prometheus remote-write protocol natively and provides MetricsQL, a backwards-compatible superset of PromQL that offers enhanced subquery performance, lower memory usage, and superior handling of high-cardinality timeseries.